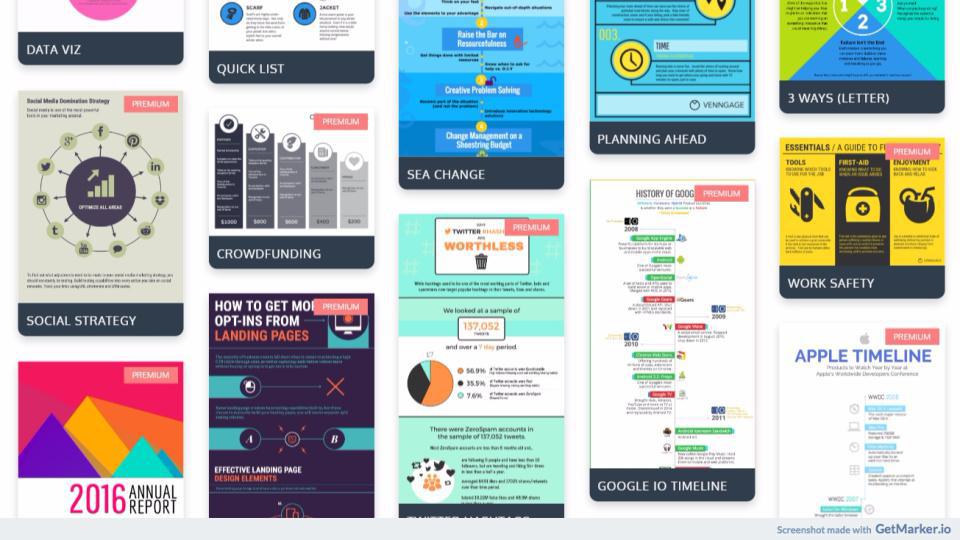
Infographis quickly convey informationvisually. There are several online websites and mobile apps with templates and tools At GreaterPlaces, we believe "making the case" for better communities needs better tools to simplify and visualize typically bland data and information.
Benefits and Problems Addressed
Social media friendly:A Hubspot study shows that infographics are liked and shared on social three times more than other any other type of content.
Better instruction response; People following directions with text and illustrations do 323% better than people following directions without illustrations.
Tips & Techniques
Getting started: If you have an in-house graphics team, hone in on what you need to communicate. See what graphics packages they have and whether you can get a license. If you don't have a team or are working alone, check out various graphics packages to see which ones are free or have trials.
Typical uses: (1) Data told best with multiple charts: pie charts, bar graphs, Venn diagrams; (2) Processes with multiple steps, in other words, better looking flow charts; (3) Timelines or sequential events;
The secret to a good infographic: (1) Great use of color to catch and hold attention (as well as delight the reader); (2) Fonts that stand out separately or in combination; (3) Telling many different stories in one place; (4) Great statistics that will spur people to awareness and action ; and (5) Getting inside the reader's head and communicating something they need to know to make life better.
Hot Buttons: Some companies and organizations have strict rules on who creates content.
Resources
Canva and Easel.ly are free but with easy in-app purchases to premium photographs, templates and graphics. The header image is our work in an infographic format. Venngage, Picktochart let you create and publish infographics (and include animation).
For professional purposes, Visualize.me is a site for creating visual, graphic resumes. This article from Digital Insights include social media visualizers for reports and tracking.

